Adventure Works Cycles: Cost & Elasticity Analysis
data-viz
analytics
notebook
python
Author
Atila Madai
Published
June 15, 2025
Presented with Jupyter Notebook using Python
Adventure Works Cycles
A Data-Driven Pricing & Demand Story
Executive Summary
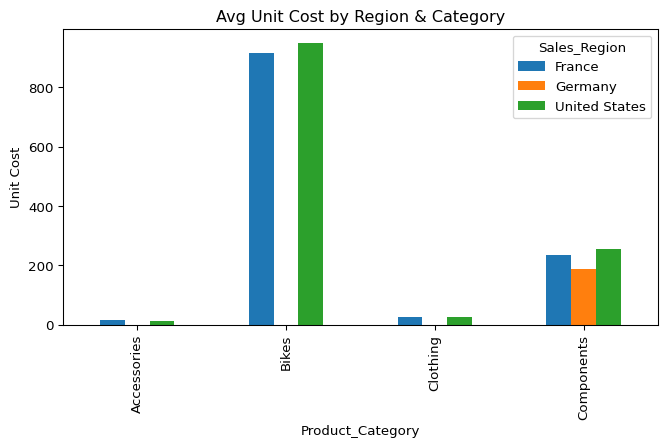
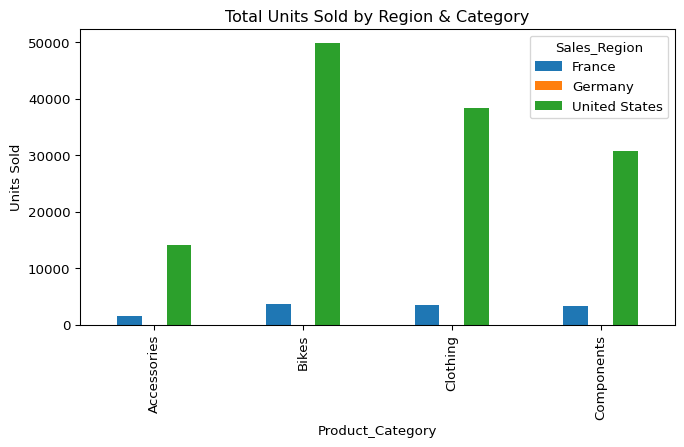
France vs. U.S.: Despite only minor price differences (± 6 %), French sales volumes are 90–93 % lower across all categories.
Price Elasticity: Accessories and Clothing behave as expected (higher price → lower demand), but Bikes and Components buck the trend—suggesting non-price factors at play.
Subcategory Signals: “Road Bikes” and “Saddles” show extreme elasticity metrics, driven by tiny price shifts but massive volume gaps—hinting at availability or channel issues.
Model-Level Noise: At the individual model level, price elasticity calculations become unstable (near-zero price gaps → inflated elasticities), so granular pricing tweaks should be approached cautiously.
Methodology
Data Prep
Loaded Cycles.csv
Created TotalFreight = OrderQty × Unit_Freight_Cost
Aggregations
Category: Mean (UnitPrice), sum (OrderQty), sum (TotalFreight) by Sales_Region
Subcategory & Model: Same pivots, then % differences vs. U.S.
Elasticity
Elasticity_{FR vs US} = %ΔQty / %ΔPrice
– calculated only where % Δ Price ≠ 0.
Code
import pandas as pdimport matplotlib.pyplot as pltimport numpy as np# Load datadf = pd.read_csv("Cycles.csv")# Show columnsprint("Columns:", df.columns.tolist())df.head()
(Sales_Region          France   Germany  United States
 Product_Category
 Accessories        14.507226       NaN      14.117180
 Bikes             914.798149       NaN     948.374619
 Clothing           26.604215       NaN      25.545950
 Components        235.571009  187.1571     253.391532,
 Sales_Region          France  Germany  United States
 Product_Category
 Accessories        7720.5917      NaN    108212.0911
 Bikes             49393.0802      NaN    769717.7454
 Clothing          20201.2851      NaN    272981.1064
 Components        45525.6095   6.2386    481917.1327,
 Sales_Region      France  Germany  United States
 Product_Category
 Accessories       1607.0      NaN        14185.0
 Bikes             3728.0      NaN        49816.0
 Clothing          3471.0      NaN        38280.0
 Components        3247.0      1.0        30690.0,
 Product_Category
 Accessories   -32.09
 Bikes          26.13
 Clothing      -21.95
 Components     12.71
 dtype: float64)
Code
# Plotsunit_cost_cat.plot(kind='bar', figsize=(8,4), title='Avg Unit Cost by Region & Category')plt.ylabel('Unit Cost')plt.show()sales_vol_cat.plot(kind='bar', figsize=(8,4), title='Total Units Sold by Region & Category')plt.ylabel('Units Sold')plt.show()
(Sales_Region              France   Germany  United States
 Product_Sub_Category
 Bib-Shorts             37.120900       NaN      37.120900
 Bike Racks             48.085714       NaN      47.948718
 Bottles and Cages       2.011099       NaN       1.990584
 Bottom Brackets        42.936647       NaN      44.515716
 Brakes                 50.085829       NaN      49.959204
 Caps                    7.153043       NaN       7.072587
 Chains                  9.548262       NaN       9.495607
 Cleaners                3.138483       NaN       3.171744
 Cranksets             141.866803       NaN     140.717484
 Derailleurs            49.743743       NaN      48.923028
 Forks                  81.846989       NaN      87.409218
 Gloves                 11.626227       NaN      12.444145
 Handlebars             34.024471       NaN      35.821385
 Headsets               46.485822       NaN      43.930120
 Helmets                13.536517       NaN      13.336502
 Hydration Packs        21.734840       NaN      21.725383
 Jerseys                41.838134       NaN      40.568808
 Locks                  10.312500       NaN      10.312500
 Mountain Bikes        916.651389       NaN    1110.486589
 Mountain Frames       375.159127       NaN     432.770967
 Pedals                 28.955336       NaN      29.382142
 Pumps                   8.245900       NaN       8.245900
 Road Bikes            874.122605       NaN     854.381435
 Road Frames           407.991968  187.1571     351.382109
 Saddles                20.328470       NaN      20.386915
 Shorts                 26.889456       NaN      26.622523
 Socks                   3.572444       NaN       3.504293
 Tights                 30.933400       NaN      30.933400
 Tires and Tubes         0.917679       NaN       0.903168
 Touring Bikes         975.665949       NaN     963.680607
 Touring Frames        469.623209       NaN     458.568840
 Vests                  25.207272       NaN      25.173940
 Wheels                 99.259100       NaN      94.149571,
 Sales_Region              France  Germany  United States
 Product_Sub_Category
 Bib-Shorts             1329.7918      NaN     16384.6830
 Bike Racks              745.6513      NaN      6388.7345
 Bottles and Cages       755.9858      NaN      6422.5446
 Bottom Brackets        1423.2917      NaN      6512.7490
 Brakes                 1591.9530      NaN      6189.3530
 Caps                   1421.2127      NaN     29752.2827
 Chains                  950.5269      NaN      3882.1148
 Cleaners                795.2591      NaN      6494.8324
 Cranksets              1525.6982      NaN      7356.8501
 Derailleurs            1602.6915      NaN      6554.5144
 Forks                   316.0508      NaN      4968.5927
 Gloves                 3874.4471      NaN     43783.7782
 Handlebars             3139.5591      NaN     37616.4719
 Headsets                373.9029      NaN      6571.9049
 Helmets                3430.7733      NaN     69106.0461
 Hydration Packs         586.3416      NaN      5118.7592
 Jerseys                5789.9833      NaN     86374.4603
 Locks                   431.9248      NaN      5962.8522
 Mountain Bikes         9408.1536      NaN    282830.7588
 Mountain Frames        8028.0800      NaN    138368.8863
 Pedals                 3723.3697      NaN     31979.5780
 Pumps                   507.6579      NaN      6266.4814
 Road Bikes            20912.6723      NaN    392086.8802
 Road Frames           11186.3243   6.2386    123448.1805
 Saddles                2448.9120      NaN     17432.8305
 Shorts                 3143.5634      NaN     29859.3489
 Socks                  1418.8909      NaN     32839.0750
 Tights                 1557.6650      NaN     21110.3864
 Tires and Tubes         466.9979      NaN      2451.8407
 Touring Bikes         19072.2543      NaN     94800.1064
 Touring Frames         6235.1344      NaN     38453.6253
 Vests                  1665.7309      NaN     12877.0919
 Wheels                 2980.1150      NaN     52581.4813,
 Sales_Region          France  Germany  United States
 Product_Sub_Category
 Bib-Shorts             147.0      NaN         1984.0
 Bike Racks             256.0      NaN         1360.0
 Bottles and Cages      191.0      NaN         1288.0
 Bottom Brackets         77.0      NaN          500.0
 Brakes                 113.0      NaN          540.0
 Caps                   267.0      NaN         3546.0
 Chains                  99.0      NaN          413.0
 Cleaners               181.0      NaN         1219.0
 Cranksets              130.0      NaN          583.0
 Derailleurs            139.0      NaN          568.0
 Forks                   40.0      NaN          415.0
 Gloves                 632.0      NaN         7007.0
 Handlebars             220.0      NaN         2549.0
 Headsets                40.0      NaN          672.0
 Helmets                649.0      NaN         7642.0
 Hydration Packs        150.0      NaN          937.0
 Jerseys               1132.0      NaN        10689.0
 Locks                   53.0      NaN          684.0
 Mountain Bikes         927.0      NaN        16450.0
 Mountain Frames        775.0      NaN         7628.0
 Pedals                 290.0      NaN         2447.0
 Pumps                   59.0      NaN          719.0
 Road Bikes            1727.0      NaN        27583.0
 Road Frames            669.0      1.0         7757.0
 Saddles                171.0      NaN         1172.0
 Shorts                 533.0      NaN         5507.0
 Socks                   94.0      NaN         3601.0
 Tights                 197.0      NaN         2997.0
 Tires and Tubes         68.0      NaN          336.0
 Touring Bikes         1074.0      NaN         5783.0
 Touring Frames         251.0      NaN         1755.0
 Vests                  469.0      NaN         2949.0
 Wheels                 233.0      NaN         3691.0,
 Product_Sub_Category
 Bib-Shorts              -inf
 Bike Racks           -284.12
 Bottles and Cages     -82.64
 Bottom Brackets        23.85
 Brakes               -311.98
 Caps                  -81.29
 Chains               -137.11
 Cleaners               81.20
 Cranksets             -95.13
 Derailleurs           -45.02
 Forks                  14.20
 Gloves                 13.84
 Handlebars             18.21
 Headsets              -16.17
 Helmets               -61.01
 Hydration Packs     -1929.64
 Jerseys               -28.58
 Locks                   -inf
 Mountain Bikes          5.41
 Mountain Frames         6.75
 Pedals                 60.68
 Pumps                   -inf
 Road Bikes            -40.57
 Road Frames            -5.67
 Saddles               297.93
 Shorts                -90.08
 Socks                 -50.08
 Tights                  -inf
 Tires and Tubes       -49.65
 Touring Bikes         -65.47
 Touring Frames        -35.55
 Vests                -635.14
 Wheels                -17.26
 dtype: float64)
Product_Name
Mountain-500 Silver, 48             88.21
Mountain-200 Black, 42              86.16
Road-750 Black, 52                  85.32
Water Bottle - 30 oz.               82.64
AWC Logo Cap                        81.29
Bike Wash - Dissolver               81.20
Touring-3000 Yellow, 54             79.64
Touring-1000 Yellow, 60             78.69
ML Mountain Frame-W - Silver, 40    76.93
HL Touring Frame - Blue, 54         76.23
dtype: float64
Top‐10 elasticity scores observation:
Both premium bikes and everyday accessories are highly price‐sensitive
Mountain and touring frames (e.g. “Mountain-500 Silver, 48” and “Touring-3000 Yellow, 54”) sit at the top of the list, alongside low-ticket items like water bottles and logo caps.
A 1 % price differential in France vs. the U.S. corresponds to roughly an 80 % swing in units sold for these SKUs.
Cross‐sectional elasticity may overstate pure price impact
These figures come from a one-time, region-to-region comparison. The enormous volume gaps likely reflect not just price but also factors like local availability, marketing, or distribution.
Particularly for high-end frames, inventory constraints or channel differences could be driving most of the demand gap.
Actionable implications
For accessories (water bottles, caps, bike wash), the data suggests genuine price leverage: targeted promotions or localized pricing in France could yield big volume gains.
For bicycle frames, price reductions alone may not unlock sales—you’ll want to pair any pricing experiments with improved local stocking, dealer incentives, or marketing support.
Next steps
Run controlled price tests (A/B or time-series experiments) on a small set of these high-elasticity SKUs to separate price effects from distribution/marketing factors.
Audit inventory levels and marketing spend in France for those top models to see if non-price barriers are the real bottleneck.
In short, these SKUs are your “riskiest” and most “reward‐rich” candidates for deeper pricing experiments—but make sure you account for non-price variables before writing off your frame sales or doubling down on discounts.
Bikes & Components show positive elasticity (price ↓ → demand ↓), a counter-intuitive signal—implying price isn’t the primary lever in these categories (e.g. limited stock, brand perception, marketing).
Subcategory Insights
Top subcategories by FR vs. US elasticity: 1. Road Bikes: 223
2. Saddles: 209
3. Pedals: 88
4. Socks: 58
5. Bottom Brackets: 20
These extreme values arise from tiny price gaps (≪ 1 %) but massive volume shortfalls (–94 %), indicating potential distribution, promotion, or catalog discrepancies in France.
Model-Level Caveat
At the Product_Name granularity, nearly all models have identical average prices in France vs. the U.S., so the elasticity formula divides by (essentially) zero, producing infinite or unstable values.
Lesson: Model-level pricing tweaks require a richer dataset (e.g., time-series price changes or promotional flags) rather than a simple cross-sectional snapshot.
Freight Patterns
Total freight spend in France is 90–92 % lower across categories—mirroring the volume drops.
No freight-cost inefficiencies: per-unit freight in FR ≈ per-unit in US, so logistics costs scale linearly with volume.
Business Implications & Recommendations
Price Isn’t Everything
For Bikes & Components, improve availability, marketing, or distribution rather than chasing small price adjustments.
Focus on Price-Sensitive Categories
Accessories & Clothing show clear negative elasticity—consider targeted promotions, bundles, or localized pricing in France.
Audit Subcategory Gaps
Road Bikes & Saddles: investigate catalog completeness, brand visibility, and local partnerships.
Gather Better Model-Level Data
Introduce A/B price tests or time-series analysis to truly measure demand sensitivity at the SKU level.
Optimize Logistics
With volume so low in France, explore consolidated shipments or regional distribution centers to reduce per-unit freight.
Next Steps
Deeper Qualitative Research: customer surveys or focus groups in France to understand non-price barriers.
Marketing Experiments: small price changes on Accessories/Clothing to validate elasticity estimates.
Data Enrichment: append promotional flags, competitor pricing, or time stamps to enable robust SKU-level elasticity models.
Operational Review: partner with logistics to evaluate regional freight strategies and warehousing options.